Note
Click here to download the full example code
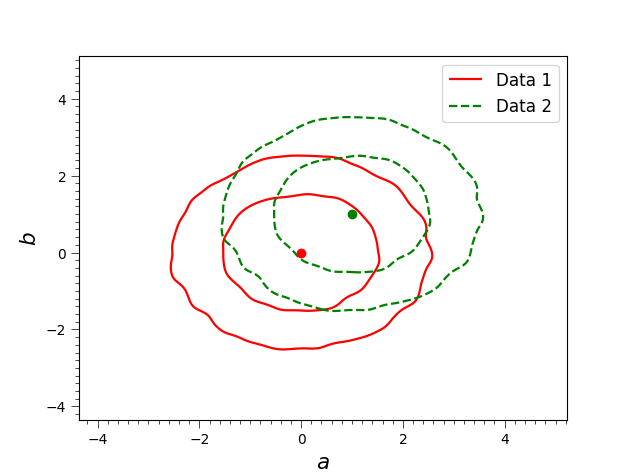
2D contour with multiple data sets by changing settings
Plot good figures with multiple data sets using more settings.
import coplot.plot_contours as plc
import matplotlib.pyplot as plt
import numpy as np


test1 = np.random.randn(50000, 2)
a1, b1 = test1[:,0], test1[:,1]
test2 = test1 + 1
a2, b2 = test2[:,0], test2[:,1]

# If you want to plot good figures, you should use it like this:
fig = plc.Plot_2d([[a1,b1],[a2,b2]]).plot(bins=150,labels=[r'$a$', r'$b$'],\
fill_contours=False,colors=['r','g'],line_styles=['-','--'], smooth=3, ticks_size=10,\
best_values=[[0,0],[1,1]], legend=True, legend_labels=['Data 1','Data 2'])
# and you can save the figure like this:
# pl.savefig('test_2d_3.pdf', fig)
plt.show()
Total running time of the script: ( 0 minutes 0.330 seconds)